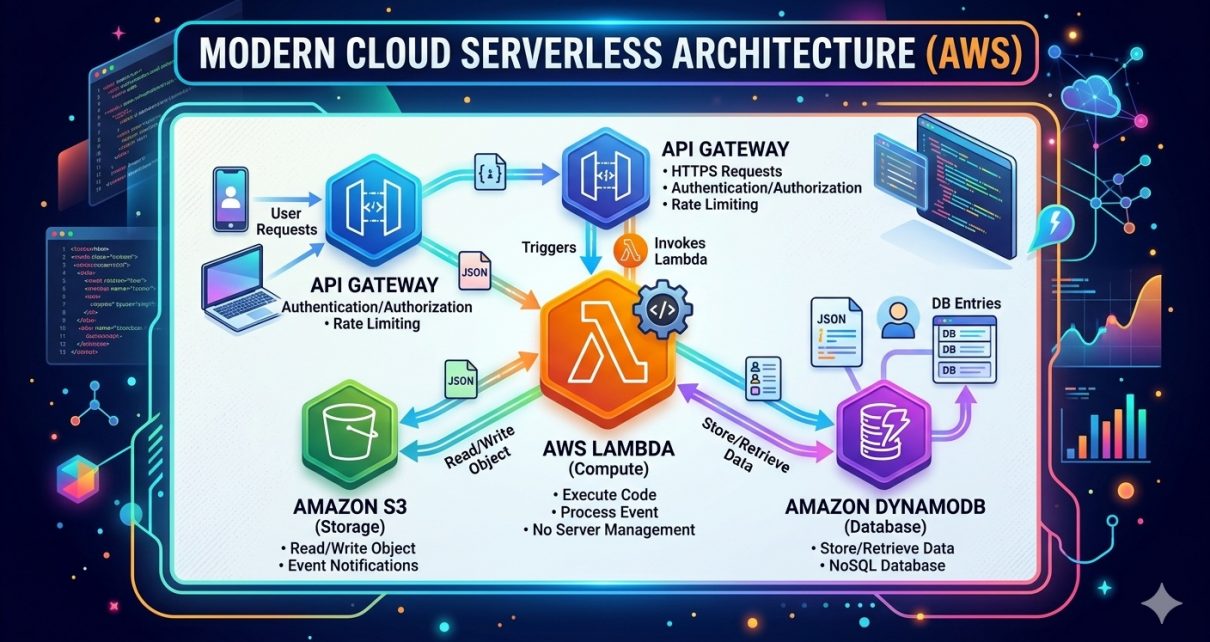
AI

CH-3 – Image Analysis – Part-3

Parametric data follows a specific distribution with consistent distances from the mean, while non-parametric data lacks a specific distribution. Mean frame histogram data, being non-parametric, employs the KS Test. Four features are chosen for extraction: Histogram, Edge, Slope, and Wavelets. Histogram feature extraction involves arranging data in columns and addressing the issue of identical mean values in different distributions by weighting the matrix with a column vector. This process ensures unique results, crucial for decision-making, as mean and variance pairs differ, offering valuable insights.

AI

CH-3 – Image Analysis – Part-2

Descriptive statistics were developed to reduce the list of all the data items to a few simpler numbers. For example, the mean, median, high, low, and standard deviation. The cumulative fraction function displays how the data is distributed, with most data clustered on the left indicating a non-normal distribution. Scaling the x-axis, typically using a log scale for positive data, allows for better visualization. The KS-test computes the maximum vertical deviation between two datasets’ cumulative fraction curves, indicating differences in distribution.