
Important Note: This article is part of the series in which TechReport.us discuss theory of Video Stream Matching.
3.3.4 – Wavelets Features Extraction
Wavelet is defined in chapter two and also for more on Harr Wavelet Literature review.
Mathematically each image’s number of Data elements. For this purpose image must has the rows and columns in the power of two. If not then it must be first bring in to this form. For this padding technique or re-sampling is applied.
After converting image’s rows and image’s columns are in the power of two.
NW = Number of Windows
R = Rows of image
C = Columns of Image
NW = ( R x C ) / (16×16)
After this number of elements per feature sub vector for positive and negative values
FvVal = NW * 2
But in case of coefficient component of feature space
FvcVal = R * C
Total values for each image after applying the wavelet.
T_wave = FvVal + FvcVal
So T_wave gives number of data elements per image after applying Harr Transformation.
3.4 – Classification
As mentioned above for decision making “Dual Statistical Approach” is applied. Dual Statistical Approach is nothing just applying statistical models in two steps. [2, 3]
Classification process is in two steps. First step is parametric approaches like MEAN, NORM and Variance. Second step is non parametric approaches like KS TEST. Why these two step are necessary.
According to experiments data of image is in that shape. This is not essay to draw a line for particular class. Parametric methods are essaying to apply but these methods not provide the cuts for classes which are necessary for boundary for classification of a image. First parametric approaches applied, trying to go closer to target.
Then pick the smallest value and its location of frame. After getting the smallest value location now applied non parametric model on it with source image. This will give the required result.
System is also provides the flexibility due to two steps approach. Its not hard and fast Rule to apply in second step is a statistical model. Here on second step any other approach like pixel by pixel comparison or again parametric approaches or subtraction of image is also applied for classification
3.4.1 – Minimum Distance Classifier
The minimum distance classifier is used to classify unknown image data to classes which minimize the distance between the image data and the class in multi-feature space. The distance is defined as an index of similarity so that the minimum distance is identical to the maximum similarity. [2, 3]
3.4.1.1 – Euclidian Distance
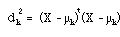
Is
used in cases where the variances of the population classes are
different to each other. The Euclidian distance is theoretically
identical to the similarity index.
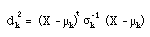
3.4.1. – Normalized Euclidian Distance
The
Normalized Euclidian distance is proportional to the similarity in
dex,
in the case of difference variance.
3.4.1.3 – Mahalanobis Distance
In
cases where there is correlation between the axes in feature space,
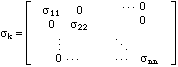
the Mahalanobis distance with variance-covariance matrix,
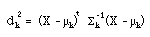
where
X : vector of image data (n bands)
X
= [ x1, x2, …. xn]
k : mean of the kth class
k = [ m1, m2,
…. mn]
k : variance matrix